What it cost to serve multiple farmers at once
- · The agronomist opens QGIS, downloads imagery by hand, and computes NDVI in a spreadsheet. Analyzing a single satellite scene took days. Multiple scenes per field were worse. The result was a raw raster or an Excel file — not an actionable recommendation.
- · No historical baseline per field, no alerts, no multi-tenant. Each analysis was a one-off. Scenes were not compared over time, NDVI was not cross-referenced with NDWI, and trends went undetected. If Quantum-PH wanted to serve more than one farmer, the manual process was repeated one by one.
- · Raw pixels do not speak to the farmer. An unclassified NDVI raster is noise for the decision maker. Without a layer that says "this patch has confirmed water stress and the intervention window is this week", the value of the analysis stays locked in the agronomist's head.
What the platform changed
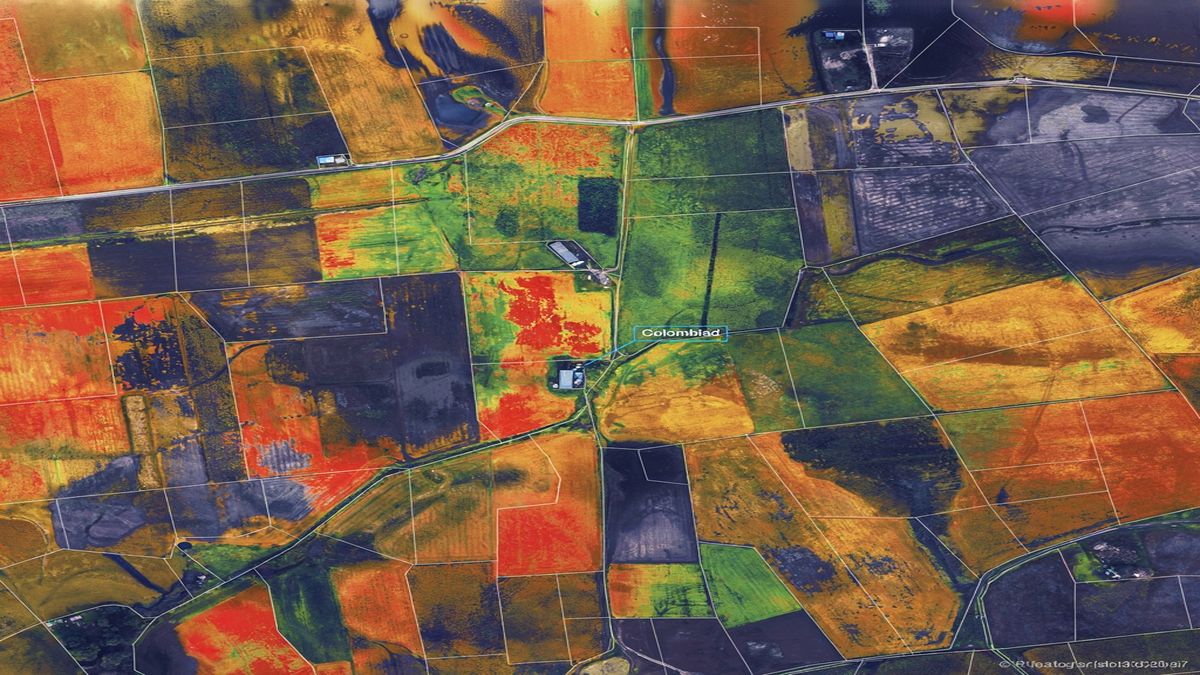
- · Unified raster pipeline, satellite and drone in the same system. The FastAPI backend ingests Sentinel-2 multiband scenes and drone GeoTIFFs (RGB or multispectral), normalizes CRS, reprojects to the field grid, and leaves the data ready for index computation. The agronomist downloads nothing by hand.
- · NDVI and NDWI per pixel, classified by moisture. The system computes both indices on every patch of the field, crosses them to classify the level of compromise (low NDVI + low NDWI = confirmed water stress), and returns a map classified by zone — not a raw array.
- · Operational recommendations with an intervention window. Every alert carries the type of intervention (irrigation, fertilization, replanting), the optimal window per crop and zone, and a reference to the specific raster patch. The farmer knows what to do, where, and when.
From Sentinel-2 scenes and drone flights to actionable per-zone alerts
The hard part was not computing NDVI or NDWI — that is a subtraction over two bands. The hard part was building the pipeline that ingests rasters in different formats and resolutions, normalizes them, reprojects them, computes the indices over gigabytes of raster per tenant, and returns something the farmer can act on — not a GeoTIFF they have to open in QGIS. The three critical decisions were:
- 1 Satellite + drone raster ingestion in a single pipeline. Imagery arrives in different formats and resolutions (Sentinel-2 multiband, drone RGB or multispectral GeoTIFF). The backend normalizes, reprojects to a common CRS, and leaves the data ready for index computation without reprocessing.
- 2 NDVI and NDWI per pixel on every patch of the field. The math is cheap; doing it well over gigabytes of raster, per tenant, without crashing the backend is the hard part. Rasterio + vectorized NumPy, cache by date and field, and responses that return a classified map, not a raw array.
- 3 Operational recommendations, not just maps. The system does not stop at "this zone is arid". It classifies the level of compromise (low NDVI + low NDWI = confirmed water stress), crosses it with the field's history, and emits an actionable alert: type of intervention, optimal window, and reference to the specific raster patch.
┌──────────────────┐
│  Sentinel-2 +    │  ◄── Multiband raster, drone GeoTIFF
│  Drone GeoTIFF   │      per field / per tenant
└────────┬─────────┘
         │ Ingestion, normalization, CRS reprojection
         ▼
┌──────────────────┐
│  FastAPI +       │  ◄── Per-pixel NDVI / NDWI
│  Rasterio+NumPy  │      moisture classification
│  + PostgreSQL    │      cache by date and field
└────────┬─────────┘
         │ Zone-classified result
         ▼
┌──────────────────┐
│  Operational     │  ◄── Recommendations
│  alerts +        │      type of intervention,
│  React dashboard │      optimal window, patch
└──────────────────┘ What we took away
- 01
Spectral indices are cheap — the pipeline is not
NDVI is a subtraction over two bands. What costs is moving, normalizing, reprojecting, and serving them to N tenants without collision. The value is not in the algorithm; it is in the pipeline that surrounds it.
- 02
A classified map is better than a raw raster
The farmer does not open QGIS. They want to see "your field 3 has 12% of pixels under water stress" and the alert. Returning an NDVI.tif and leaving it to the client is losing the value of the SaaS.
- 03
Multi-tenant is not just data isolation — it is compute isolation
If one tenant uploads 200 Sentinel scenes, the others cannot be left waiting. The backend needs per-tenant queues, priorities, and limits. This is designed in from day one, or rewritten at month six.
"We used to depend on the agronomist opening QGIS, downloading the imagery by hand, and computing NDVI in Excel. Today the platform ingests the satellite scenes and the drone flights on its own, and delivers per field the zones under water stress and the recommended intervention window. We went from an analysis that took a week to alerts that arrive the same day."
Paraphrased testimonial.
Got a precision agriculture case that still depends on QGIS and spreadsheets?
Let's talk about closing the loop from imagery to operational alerts with NDVI, NDWI, and per-field recommendations.